MAHINDRA MANULIFE
FLEXI CAP YOJANA
An open ended dynamic equity scheme investing
across large cap, mid cap, small cap stocks)
(Scheme Code : MMFCY)

One Pager as on November 30, 2022
 | Flexibility to invest in opportunities across market capitalization |
 | Bottom up stock selection process |
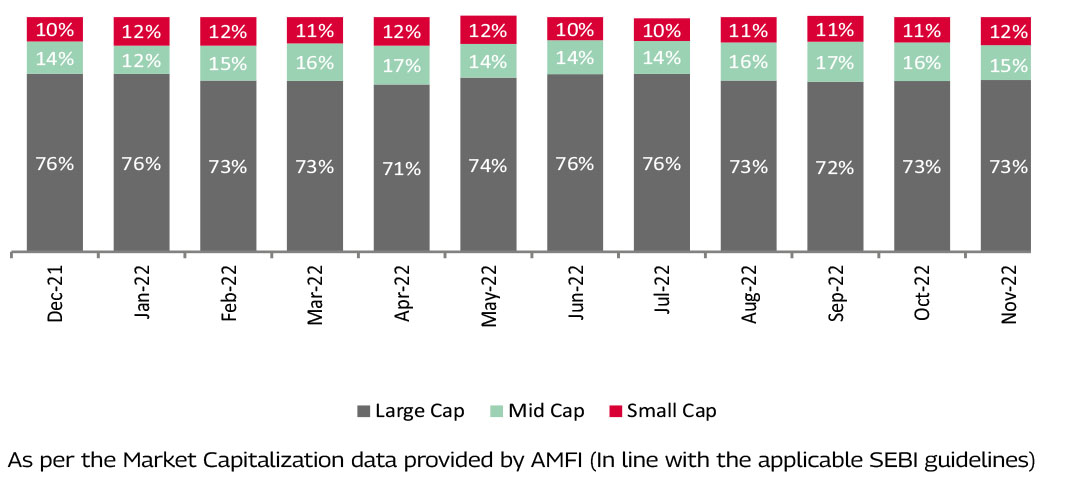
 | Active allocation across Market capitalization based on macro-economic indicators, policy environment, valuations, market conditions |
 | Top down approach to select sectors |
 | Management through diversification of holdings and disciplined approach to monitor individual stock position based on market capitalization |
- A well-diversified portfolio of companies having demonstrated industry leadership
and scalability leading to high earnings growth potential
- The portfolio will tap into emerging growth opportunities from across sectors
stemming from under penetration, structural market share shifts and technology
driven changes.
- Key Overweight sector/Industries includes Banks, Finance, IT and Capital Goods
sector vs the Schemes Benchmark
- Key Underweights sectors /Industries includes Healthcare and Oil &
Gas vs the Scheme’s Benchmark
- Portfolio is gradually shifting to smallcaps as India strengthens itself in global
volatility and rate tightening cycle is near the peak
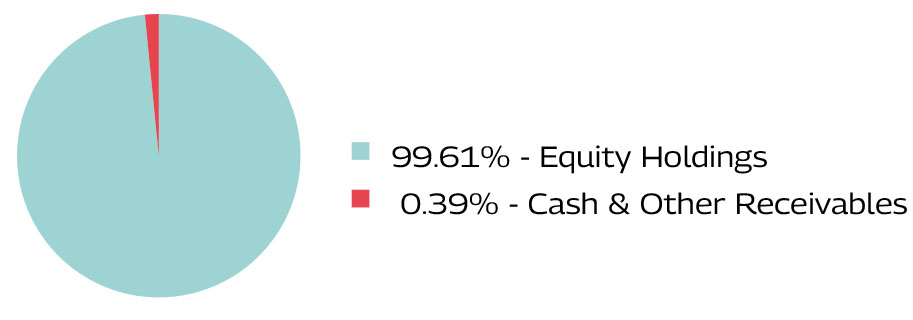
Data as on November 30, 2022
| Sector | MMFCY | Nifty 500 Index TRI |
| Financial Services | 33.00% | 30.92% |
| Information Technology | 16.09% | 11.11% |
| Capital Goods | 7.73% | 3.46% |
| Automobile And Auto Components | 5.55% | 5.60% |
| Fast Moving Consumer Goods | 5.50% | 8.03% |
Data as on November 30, 2022
| Security | % to Net Assets |
| HDFC Bank Limited | 10.18% |
| Infosys Limited | 9.93% |
| ICICI Bank Limited | 9.30% |
| Reliance Industries Limited | 5.37% |
| Hindustan Unilever Limited | 4.07% |
| Larsen & Toubro Limited | 3.66% |
| Axis Bank Limited | 3.41% |
| Tata Consultancy Services Limited | 3.12% |
| Bajaj Finance Limited | 2.94% |
| Vinati Organics Limited | 1.86% |
| Top 10 Holdings | 53.84% |
| Fresh Additions | Complete Exits |
| Security | Security |
| APL Apollo Tubes Limited | 3M India Limited |
| Deepak Nitrite Limited | Bata India Limited |
| Kaynes Technology India Limited | Havells India Limited |
| Larsen & Toubro Infotech Limited | LIC Housing Finance Limited |
| Zydus Lifesciences Limited | Mahindra & Mahindra Limited |
| MindTree Limited | |
| Sumitomo Chemical India Limited |
Note: The companies/stock(s) referred above are only for the purpose of disclosure of significant
portfolio changes during the month and should not be construed as recommendation to buy/
sell/ hold. The fund manager may or may not choose to hold these companies/stocks, from time
to time. Investors are requested to consult their financial, tax and other advisors before taking
any investment decision(s). Data as on November 30, 2022
| Turnover Ratio (Last 1 year) | 0.95 |
The investment objective of the Scheme is to generate long term capital appreciation by investing in a diversified portfolio of equity and equity-related securities across market capitalization. However, there can be no assurance that the investment objective of the Scheme will be achieved.
Fund Manager:
Ms. Fatema Pacha (Equity)
Total Experience : 17 years
Experience in managing this fund: 1 year and 3 months (Managing since August 23, 2021)
Mr. Manish Lodha (Equity)
Total Experience : 22 years,
Experience in managing this fund: 1 year and 3 months (Managing since August 23, 2021)
Date of allotment: August 23, 2021
Benchmark: Nifty 500 Index TRI
Option: Growth; IDCW
IDCW Sub-options: IDCW Reinvestment & IDCW Payout
Minimum Application Amount: Rs. 1,000 and in multiples of Re. 1/- thereafter
Minimum Redemption/Switch-Out Amount: Rs. 1,000/- or 100 units or account balance, whichever is lower
Minimum Weekly & Monthly SIP Amount: Rs 500 and in multiples of Re. 1/- thereafter
Minimum Weekly & Monthly SIP Installments: 6
Minimum Quarterly SIP Amount: Rs 1,500 and in multiples of Re. 1/- thereafter
Minimum Quarterly SIP installments: 4
Monthly AAUM as on November 30, 2022 (Rs. in Cr.): 990.43
Monthly AUM as on November 30, 2022 (Rs. In Cr.): 985.42
Entry Load: Not applicable
Exit Load: 0.5%*
*An Exit Load of 0.5% is payable if Units are redeemed / switched-out upto 3 months from the date of allotment; Nil if Units are redeemed / switched-out after 3 months from the date of allotment.

^Benchmark ^^Additional Benchmark. Inception/Allotment date: 23-Aug-21.
Past performance may or may not be sustained in future and should not be used as a basis of comparison with other investments. Since inception returns of the scheme is calculated on face value of Rs. 10 invested at inception. The performance details provided above are of Growth Option under Regular Plan. Different Plans i.e Regular Plan and Direct Plan under the scheme has different expense structure. . *Based on standard investment of Rs. 10,000 made at the beginning of the relevant period.

^Benchmark ^^Additional Benchmark. CAGR – Compounded Annual Growth Rate. Inception/Allotment date: 23-August-21.
Past performance may or may not be sustained in future and should not be used as a basis of comparison with other investments. Returns greater than 1 year period are compounded annualized. For SIP returns, monthly investment of equal amounts invested on the 1st business day of every month has been considered. CAGR Returns (%) are computed after accounting for the cash flow by using the XIRR method (investment internal rate of return).
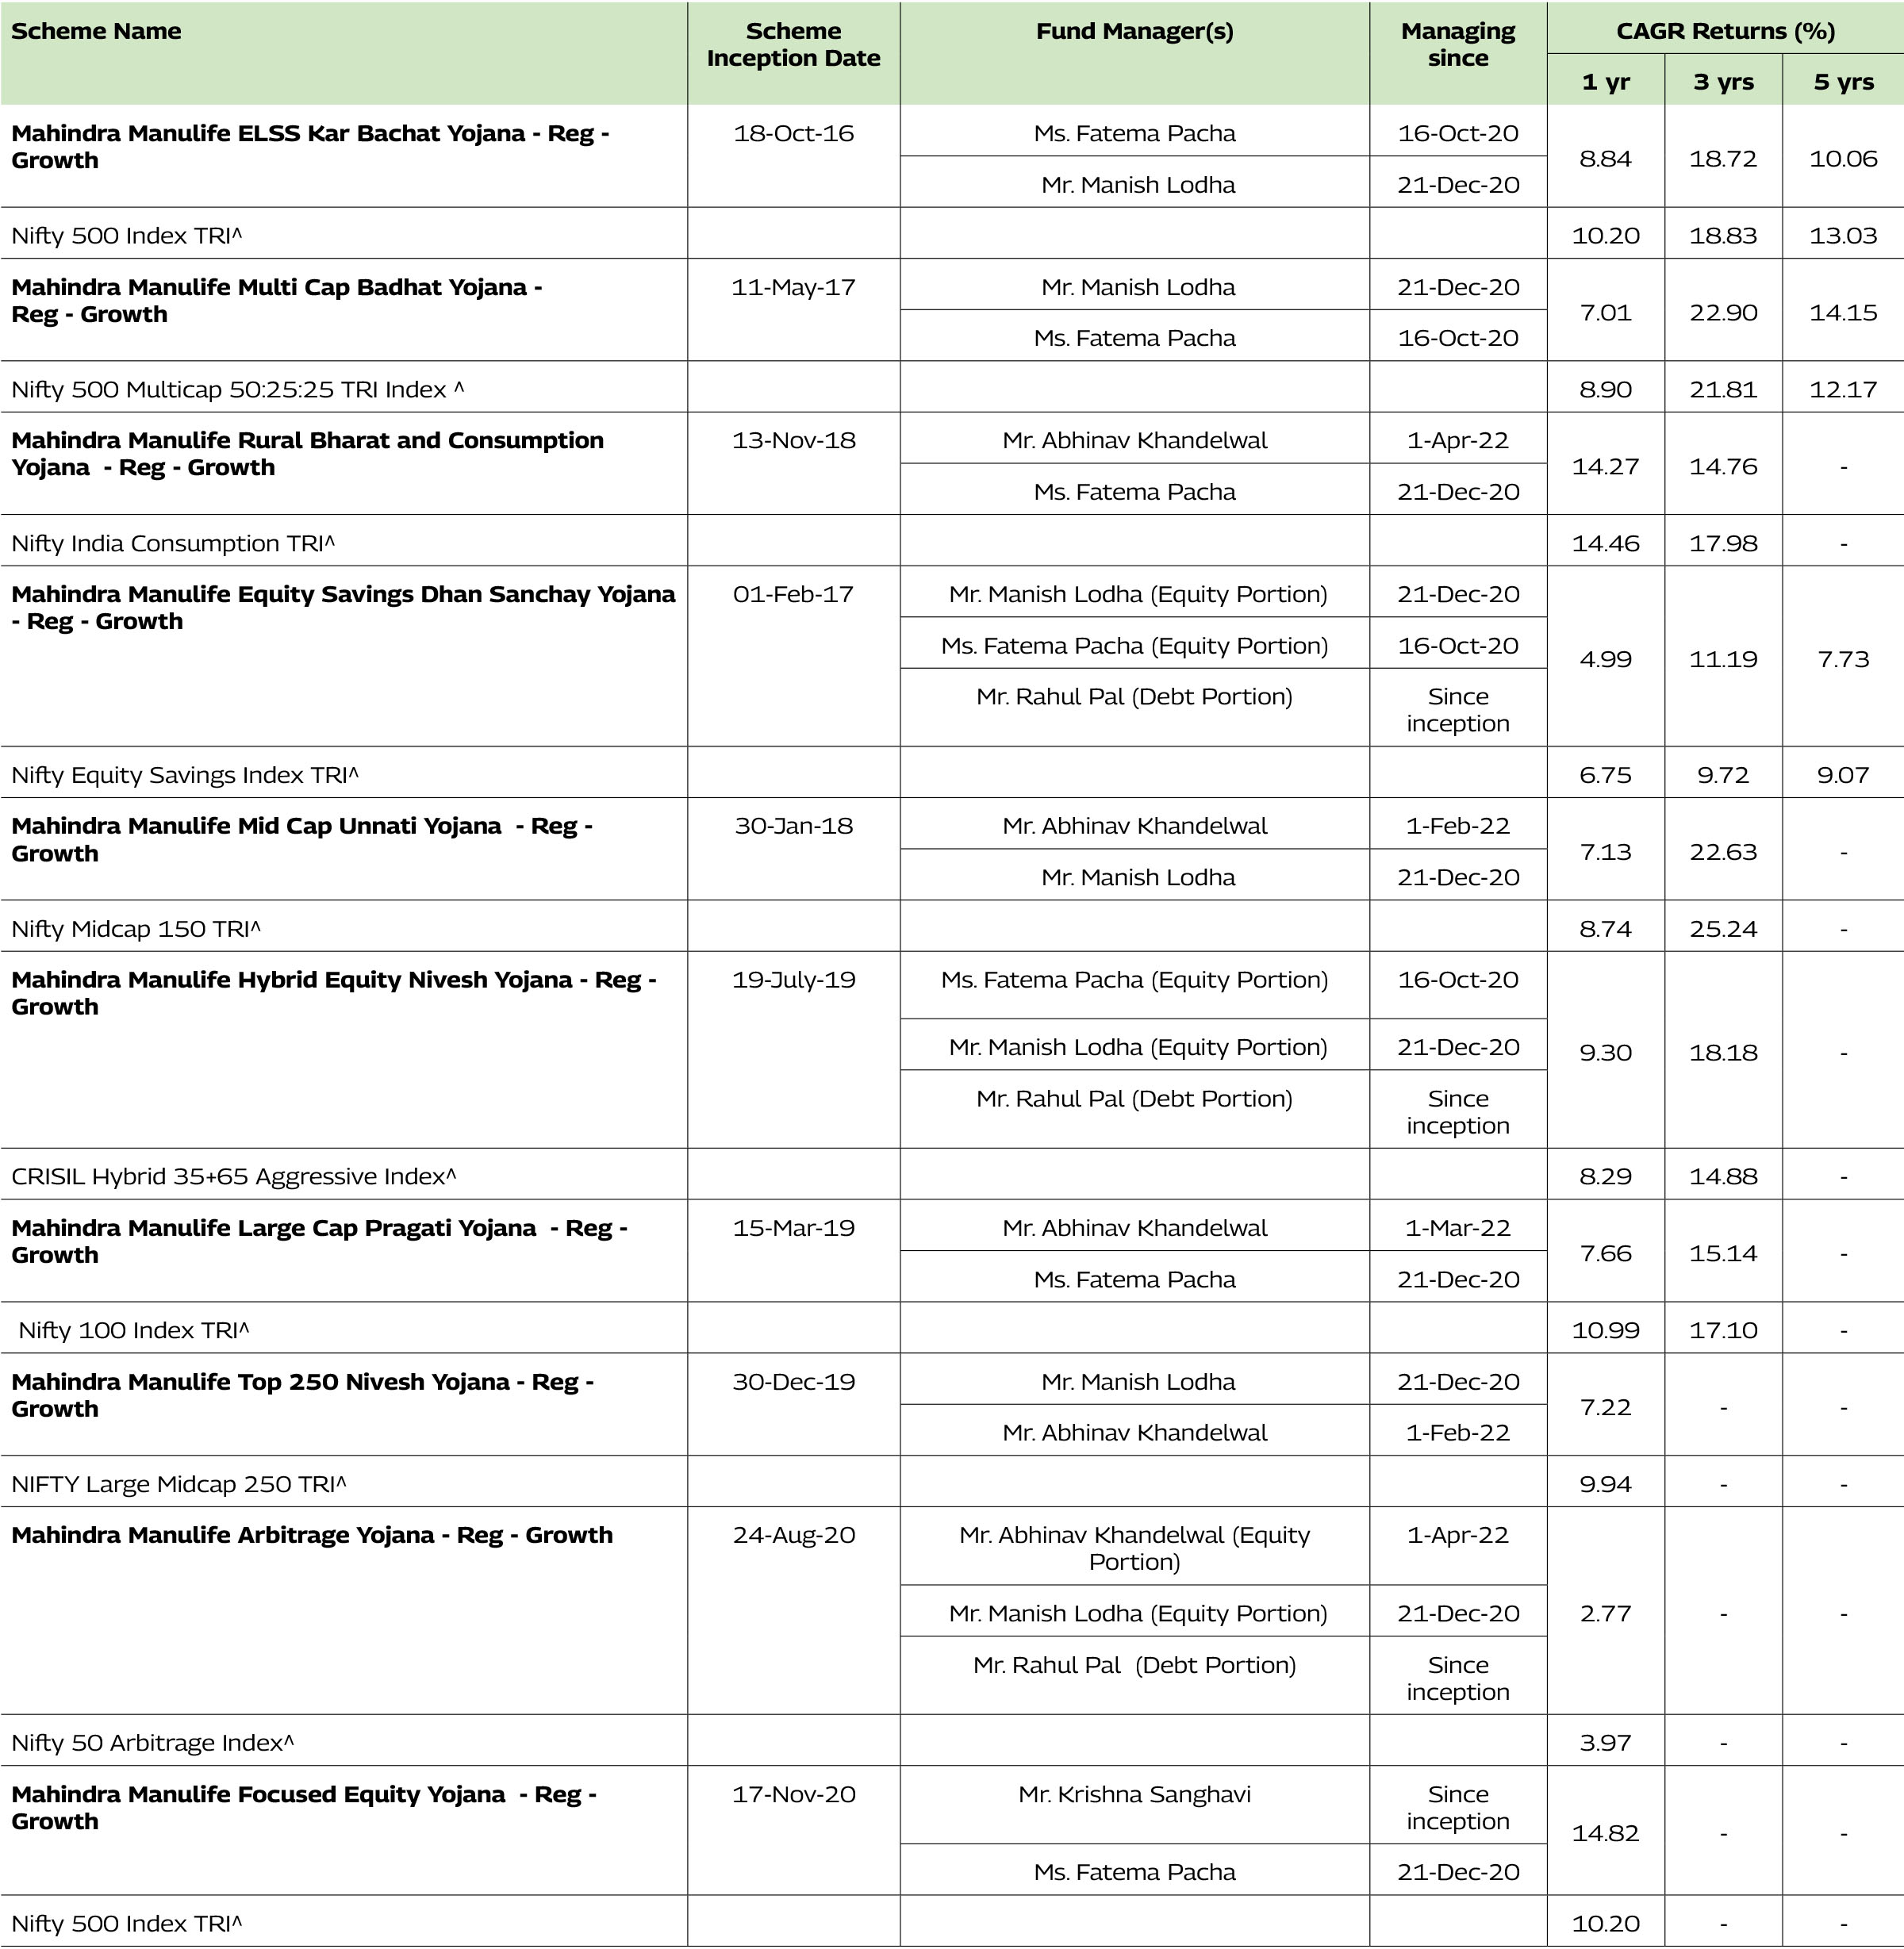
^Benchmark CAGR – Compounded Annual Growth Rate.
Past performance may or may not be sustained in future and should not be used as a basis of comparison with other investments. The performance details provided above are of Growth Option under Regular Plan Different Plans i.e Regular Plan and Direct Plan under the scheme has different expense structure. Mr. Manish Lodha and Ms. Fatema Pacha manage
9 schemes each of Mahindra Manulife Mutual Fund. The performance data for the schemes which have not completed one year has not been provided.
Performance as on November 30, 2022.
Mahindra Manulife Flexi Cap Yojana
This product is suitable for investors who are seeking*:
• Long term capital appreciation.
• Investment in diversified portfolio of
equity & equity related instruments
across market capitalization
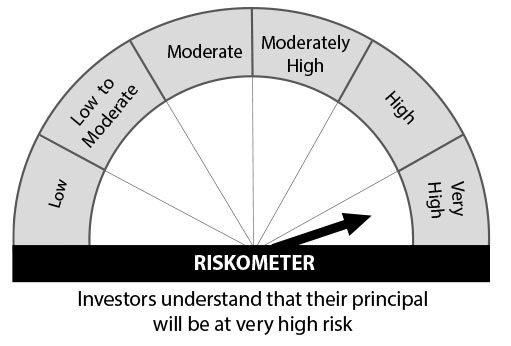
Nifty 500 Index TRI
Benchmark Riskometer
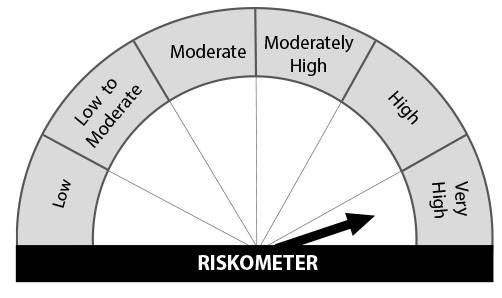
*Investors should consult their financial advisers if in doubt about whether the product is suitable for them.
Reach us at: Sadhana House, 1st Floor, 570,
P.B. Marg, Worli, Mumbai - 400 018, India.
Phone: +91-22-66327900, Fax: +91-22-66327932
Toll Free No.: 1800 419 6244
Website: www.mahindramanulife.com


