MAHINDRA MANULIFE ELSS TAX SAVER FUND
(An open ended equity linked saving scheme
with a statutory lock in of 3 years and tax benefit)
 |
 |
 |
 |
 |
| Data as on 31st, May 2024 | ||||
| Investment Objective | The investment objective of the Scheme is to generate long term capital appreciation through a diversified portfolio of equity and equity related securities. The Scheme does not guarantee or assure any returns. |
| Fund Features | Potential Capital Appreciation: Scheme invests in a diversified equity portfolio thereby offering the investor, possibility of growing their investments. Tax Benefit: Investments in this scheme are entitled for tax deduction under section 80C. Possibility of saving upto Rs. 51,480/-*. Lock-in Feature: This feature endeavors to protect your investments from impact of short term market volatility. Lock-in of only 3 years! Other traditional tax savings options may have longer holding periods. *Assuming investor uses the entire Rs 1.50 lac limit available under Section 80C of the Income Tax Act 1961 for investing in Mahindra Manulife ELSS Tax Saver Fund. The tax benefit is calculated on the basis of current applicable tax rates under the old regime (Refer Note at the end of the page), ignoring marginal relief on surcharge, if any, for net taxable income between Rs 50 lacs and Rs 1 crore. Please consult your financial / tax advisor before investing. |
| Fund Manager and Experience | Fund Manager: Ms. Fatema Pacha Total Experience: 18 years Experience in managing this fund: 3 years and 7 months (managing since October 16, 2020) Fund Manager: Mr. Manish Lodha Total Experience: 23 years Experience in managing this fund: 3 years and 5 months (Managing since December 21, 2020) |
| Date of allotment | October 18, 2016 |
| Benchmark | Nifty 500 TRI Index |
| Options | IDCW (IDCW Option will have only
IDCW Payout facility) and Growth (D) D- Default |
| Minimum Application Amount | Rs. 500 and in multiples of Rs. 500 thereafter |
| Minimum Additional Purchase Amount: | Rs. 500 and in multiples of Rs. 500 thereafter |
| Minimum Repurchase Amount: | Rs. 500 or 50 units or account balance, whichever is lower |
| SIP | Minimum Weekly & Monthly SIP Amount: Rs 500 and in multiples of Rs 500 thereafter Minimum Weekly & Monthly SIP Installments: 6 Minimum Quarterly SIP Amount: Rs 1,500 and in multiples of Rs 500 thereafter Minimum Quarterly SIP installments: 4 |
| Monthly AAUM as on May 31, 2024 (Rs. in Cr.): | 860.41 |
| Monthly AUM as on May 31, 2024 (Rs. in Cr.): | 866.79 |
| Total Expense Ratio1 as on May 31, 2024: |
Regular Plan: 2.17% Direct Plan: 0.60% 1Includes additional expenses charged in terms of Regulation 52 (6A) (b) and 52 (6A) (c) of SEBI (Mutual Funds) Regulations, 1996 and Goods and Services Tax. Note: The Finance Act 2020 has introduced a new income tax regime at concessional tax rates for individual taxpayers. However, the option for such concessional tax regime requires the taxpayer to forego certain specified deductions including deduction u/s 80C of Income Tax Act, 1961 |
| Load Structure: | Entry Load: N.A. Exit Load: Nil |
| Portfolio Turnover Ratio (Last 1 year): | 0.82 |
| Standard Deviation: | 12.44% |
| Beta: | 0.91 |
| Sharpe Ratio#: | 0.82 |
| Jenson’s Alpha : | 0.0118 |
| #Risk-free rate assumed to be 6.76% (MIBOR as on 31-05-24) -
Source: www.mmda.org Note: As per AMFI guidelines for factsheet, the ratios are calculated based on month rolling returns for last 3 years. Data as on May 31, 2024 |
|
| NAV/Unit | Regular Plan (In Rs.) |
Direct Plan (In Rs.) |
| IDCW | 17.9344 |
21.3631 |
| Growth | 26.0732 |
30.0455 |
| IDCW: Income Distribution cum Capital Withdrawal |
||
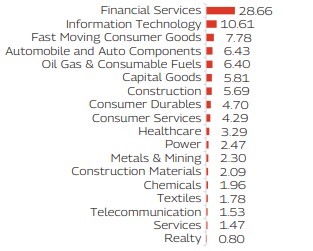
Company / Issuer |
% of Net Assets |
|
|---|---|---|
| Automobile and Auto Components | 6.43% |
|
 |
Maruti Suzuki India Limited | 2.87% |
| UNO Minda Limited | 1.48% |
|
| Schaeffler India Limited | 1.06% |
|
| Tata Motors Limited | 1.02% |
|
| Capital Goods | 5.81% |
|
| Honeywell Automation India Limited | 1.66% |
|
| CG Power and Industrial Solutions Limited | 1.44% |
|
| Graphite India Limited | 0.91% |
|
| Ratnamani Metals & Tubes Limited | 0.90% |
|
| Finolex Industries Limited | 0.47% |
|
| Bharat Electronics Limited | 0.43% |
|
| Chemicals | 1.96% |
|
| Vinati Organics Limited | 1.04% |
|
| Navin Fluorine International Limited | 0.92% |
|
| Construction | 5.69% |
|
|
Larsen & Toubro Limited | 4.14% |
| Kalpataru Projects International Limited | 1.55% |
|
| Construction Materials | 2.09% |
|
| Shree Cement Limited | 1.64% |
|
| JK Cement Limited | 0.45% |
|
| Consumer Durables | 4.70% |
|
| Voltas Limited | 1.97% |
|
| Crompton Greaves Consumer Electricals Limited | 1.50% |
|
| Asian Paints Limited | 1.23% |
|
| Consumer Services | 4.29% |
|
| Avenue Supermarts Limited | 1.42% |
|
| Info Edge (India) Limited | 1.18% |
|
| Restaurant Brands Asia Limited | 1.02% |
|
| Thomas Cook (India) Limited | 0.66% |
|
| Fast Moving Consumer Goods | 7.78% |
|
|
Hindustan Unilever Limited | 2.85% |
| Britannia Industries Limited | 2.03% |
|
| Marico Limited | 1.03% |
|
| Colgate Palmolive (India) Limited | 0.97% |
|
| Gillette India Limited | 0.91% |
|
| Financial Services | 28.66% |
|
|
HDFC Bank Limited | 8.36% |
|
ICICI Bank Limited | 7.57% |
|
State Bank of India | 2.91% |
|
IndusInd Bank Limited | 2.79% |
| Axis Bank Limited | 2.68% |
|
| Bank of Baroda | 1.32% |
|
| Union Bank of India | 1.10% |
|
| The South Indian Bank Limited | 1.05% |
|
| L&T Finance Limited | 0.88% |
|
| Healthcare | 3.29% |
|
| Piramal Pharma Limited | 1.37% |
|
| GlaxoSmithKline Pharmaceuticals Limited | 1.03% |
|
| Alembic Pharmaceuticals Limited | 0.89% |
|
| Information Technology | 10.61% |
|
|
Infosys Limited | 4.64% |
|
Tata Consultancy Services Limited | 2.78% |
| LTIMindtree Limited | 1.33% |
|
| Wipro Limited | 1.06% |
|
| Cyient Limited | 0.80% |
|
| Metals & Mining | 2.30% |
|
| Hindalco Industries Limited | 1.27% |
|
| Kirloskar Ferrous Industries Limited | 1.02% |
|
| Oil Gas & Consumable Fuels | 6.40% |
|
|
Reliance Industries Limited | 4.03% |
| Oil & Natural Gas Corporation Limited | 1.23% |
|
| Coal India Limited | 1.13% |
|
| Power | 2.47% |
|
| NTPC Limited | 2.47% |
|
| Realty | 0.80% |
|
| DLF Limited | 0.80% |
|
| Services | 1.47% |
|
| Delhivery Limited | 0.76% |
|
| Mahindra Logistics Limited | 0.71% |
|
| Telecommunication | 1.53% |
|
| Indus Towers Limited | 1.53% |
|
| Textiles | 1.78% |
|
| Arvind Limited | 0.98% |
|
| K.P.R. Mill Limited | 0.80% |
|
| Equity and Equity Related Total | 98.03% |
|
| Cash & Other Receivables | 1.97% |
|
| Grand Total | 100.00% |
|
( Top Ten Holdings - Issuer wise) as on May 31, 2024 |
||
| Mahindra Manulife ELSS Tax Saver Fund | CAGR Returns (%) |
Value of Investment of Rs. 10,000* |
NAV / Index Value (as on May 31, 2024) |
||||||
| Managed by Ms. Fatema Pacha & Mr. Manish Lodha | 1 Year |
3 Years |
5 Years |
Since Inception |
1 Year |
3 Years |
5 Years |
Since Inception |
|
| Regular Plan - Growth Option | 29.97 |
17.49 |
17.21 |
13.40 |
13,006 |
16,226 |
22,143 |
26,073 |
26.0732 |
| Direct Plan - Growth Option | 32.05 |
19.47 |
19.18 |
15.53 |
13,215 |
17,060 |
24,072 |
30,046 |
30.0455 |
| Nifty 500 TRI Index^ | 35.06 |
18.08 |
17.83 |
15.79 |
13,517 |
16,470 |
22,732 |
30,579 |
33,168.20 |
| Nifty 50 TRI^^ | 22.95 |
14.44 |
14.93 |
14.72 |
12,302 |
14,991 |
20,072 |
28,478 |
33,285.90 |
^Benchmark ^^Additional Benchmark. CAGR – Compounded Annual Growth Rate. Inception/Allotment date: 18-Oct-16. Past performance may or may not be sustained in future and should not be used as a basis of comparison with other investments. Since inception returns of the scheme is calculated on face value of Rs. 10 invested at inception. The performance details provided above are of Growth Option under Regular and Direct Plan. Different Plans i.e Regular Plan and Direct Plan under the scheme has different expense structure. Mr. Manish Lodha is managing this fund since December 21, 2020. Ms. Fatema Pacha is managing this scheme since October 16, 2020. *Based on standard investment of Rs. 10,000 made at the beginning of the relevant period. For performance details of other schemes managed by the Fund Manager(s), please click here | Best Viewed in Landscape mode
| Mahindra Manulife ELSS Tax Saver Fund | Regular Plan |
Direct Plan |
Nifty 500 TRI Index^ |
Nifty 50 Index TRI^^ |
|||||
| SIP Investment Period | Total Amount Invested (  ) ) |
Market Value ( ) |
CAGR Returns (%) |
Market Value ( ) |
CAGR Returns (%) |
Market Value ( ) |
CAGR Returns (%) |
Market Value ( ) |
CAGR Returns (%) |
| 1 Year | 120,000 |
136,683 |
26.78 |
137,907 |
28.81 |
140,260 |
32.76 |
133,075 |
20.83 |
| 3 Years | 360,000 |
477,210 |
19.20 |
490,232 |
21.13 |
492,392 |
21.44 |
455,493 |
15.90 |
| 5 Years | 600,000 |
1,020,336 |
21.38 |
1,071,564 |
23.41 |
1,045,136 |
22.38 |
942,960 |
18.14 |
| Since Inception | 910,000 |
1,733,000 |
16.59 |
1,868,491 |
18.52 |
1,848,864 |
18.25 |
1,689,164 |
15.94 |
^Benchmark ^^Additional Benchmark. CAGR – Compounded Annual Growth Rate. Inception/Allotment date: 18-Oct-16. Past performance may or may not be sustained in future and should not be used as a basis of comparison with other investments. Returns greater than 1 year period are compounded annualized. For SIP returns, monthly investment of equal amounts invested on the 1st business day of every month has been considered. CAGR Returns (%) are computed after accounting for the cash flow by using the XIRR method (investment internal rate of return). For SIP Performance please click here | Best Viewed in Landscape mode
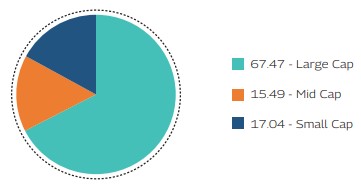
As per the latest Market Capitalisation data provided by AMFI (In line with the applicable SEBI guidelines)
Record Date |
Plan(s) / Option(s) |
IDCW |
Face Value |
Cum-IDCW NAV |
(Rs. per unit) |
(Rs. per unit) |
(Rs. per unit) |
||
17-Mar-22 |
Regular IDCW |
1.00 |
10 |
14.8463 |
17-Mar-22 |
Direct IDCW |
1.00 |
10 |
16.6096 |
27-Feb-23 |
Regular IDCW |
1.00 |
10 |
14.9950 |
27-Feb-23 |
Direct IDCW |
1.00 |
10 |
17.1833 |
14-Mar-24 |
Regular IDCW |
1.00 |
10 |
18.2013 |
14-Mar-24 |
Direct IDCW |
1.00 |
10 |
21.4077 |
Pursuant to payment of IDCW, the NAV of the IDCW Option(s) of the Scheme/Plan(s) falls to the extent of payout and statutory levy, if any. Past performance may or
may not be sustained in future and should not be used as a basis for comparison with other investments. For complete list of IDCWs, visit www.mahindramanulife.com.
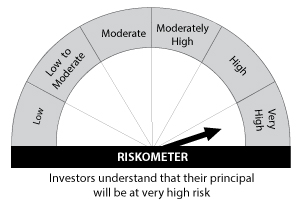
Product Suitability
|
|
| This Product is Suitable for investors who are seeking* | |
|
|
Scheme Riskometers |
Benchmark Riskometers |
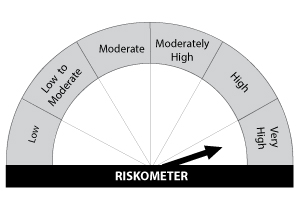 Scheme Benchmark: Nifty 500 TRI Index |
|
* Investors should consult their financial advisers if in doubt about whether the product is suitable for them. |
|